WindowsGuestDrivers/UpdatedGuestDebugging
Introduction
This page mainly introduce HOWTO use WinDbg to debug windows guest driver based on qemu.
Setup
To debug windows guest in kernel mode,we generally need a host computer as a remote debugger which runs the WinDbg and a target computer as a debuggee.
Connection between the host and target
To allow debug windows guest kernel on QEMU,we have to connect the two virtual machines by using a virtual non-modem serial cable.The QEMU serial redirection ability can help us. The simplest way is creating two windows guest virtual machines (one host,the other as target)on a same physical machine. It is feasible that the host virtual machine and target run on two different physical machines by connecting the virtual serial cable via TCP.
Setting up the host and target virtual machine
Setting up the host VM
start the host VM and install Windbg
/usr/local/bin/qemu-system-x86_64 \--enable-kvm \-m 1024 \-drive file=win-host.img \-chardev stdio,id=mon0 \-mon chardev=mon0 \-serial tcp::4445,server,nowait
Add the -serial tcp::4445,server,nowait to enable the serial redirection ability.The port number 4445 can be any valid tcp port.
Using the server option and nowait option QEMU opens a port which a client socket application can connect to it,the host will continue running without any wait.
After startup,get and install the latest version of the Debugging Tools for Windows.Get them from the website:http://www.microsoft.com/whdc/DevTools/Debugging/default.mspx or a ISO image file.
You may need restart the host virtual machine to complete the installation.
When debugging a windows driver especially kernel-mode driver,symbols typically should be installed.
Set Symbols path
You can set symbols file path by File->Symbol File Path...or [Ctrl+S].
c:\symbols\local_symbols;c:\driver\symbols;SRV*c:\symbols\websymbols*http://msdl.microsoft.com/download/symbols
also by add windows system environment variable _NT_SYMBOL_PATH,set the value to:
c:\symbols\local_symbols;c:\driver\symbols;SRV*c:\symbols\websymbols*http://msdl.microsoft.com/download/symbols
| symbol | info |
| *SRV*c:\symbols\websymbols*http://msdl.microsoft.com/download/symbols* | If symbols not found in local symbols,the WinDbg will automatic download symbols from the URL address http://msdl.microsoft.com/download/symbols . And the symbols download will be stored in the directory: c:\symbols\websymbols |
| c:\symbols\local_symbols | The symbols of current windows version.They can be acquired by website: http://msdn.microsoft.com/en-us/windows/hardware/gg463028 |
| c:\driver\symbols | This mean the symbols(*.pdb files) will be produced after build process of the driver. We can use the WinDDK debugging tool symstore.exe to create own symbols server. |
Creating local symbols server
C:\WinDDK\7600.16385.1\Debuggers>symstore.exe add /r /f C:\development\virtio-test\kvm-guest-drivers-windows\viotest\objchk_wxp_x86\i386 /s C:\driver\symbols\ /t "DriverSymbols" /v "1.0"
You can also add that into a *.bat file and create symbols automatically when every building.
Run WinDbg
Then File->Kernel Debug... or [Ctrl+k] select COM tab and set Baudrate to 115200 and set port to COM1,confirm and wait the target to connect.
Setting up the target VM
/usr/local/bin/qemu-system-x86_64 \--enable-kvm \-m 1024 \-drive file=win-target.img \-chardev stdio,id=mon0 \-mdev=mon0 \-serial tcp:127.0.0.1:4445
Add -serial tcp:127.0.0.1:4445 to connect to the host by virtual serial,port is same to the server.
When start up,if Windows XP,2003 or 2000,edit c:\boot.ini and duplicate the default boot line,at the end of the duplicated boot line add
/debug /debugport=COM1 /baudrate=115200.
The baudrate and debugport must be identical to kernel mode configure of WinDbg.
If Windows7,Vista or up,you must use BCDedit(ref:http://technet.microsoft.com/en-us/library/cc709667%28WS.10%29.aspx and http://msdn.microsoft.com/en-us/library/ff542187.aspx ).
Change the boot opition:
bcdedit /dbgsettings SERIAL \[DEBUGPORT:COM1\] \[BAUDRATE:115200\]
Debug
When Host and target setup completely,restart the target virtual machine and select the DEBUG boot option in the boot menu.
Then WinDbg on host will try to connect to the windows guest(target) kernel to debug.
You can Ctrl+Break or use the Pause button to break the guest running and also you can do anything which the debug tool support.
About WinDbg
WinDbg is a multi-purposed debugger for Microsoft Windows, distributed on the web by Microsoft. It can be used to debug user mode applications, drivers, and the operating system itself in kernel mode.
Compile and build
We first create a simple windows driver for test,it is named viotest and added in the kvm-windows-guest-driver project to maintain. The source code:
#include "virtio_test.h"
#include "virtio_test_utils.h"
VOID DriverUnload(IN PDRIVER_OBJECT DeviceObject);
   ULONG; DriverEntry( IN PDRIVER_OBJECT&; DriverObject, IN PVOID; RegistryPath ) {
   ULONG initResult = 0;
   DbgPrint("Viostor driver started...built on %s %s\n", \__DATE__, \__TIME__);
   DriverObject->DriverUnload = DriverUnload;
   DbgPrint("Initialize returned 0x%x\n", initResult);
return initResult;
}
VOID DriverUnload( IN PDRIVER_OBJECT DeviceObject ){
DbgPrint("Driver Unload successfully\! \n");
}
Add Makefile and SOURCES file into the project The driver only include DriverEntry(),DriverUnload() and some message print. The driver is not related to any specific device. All the simplification are done in order to increase the convenience of debug.
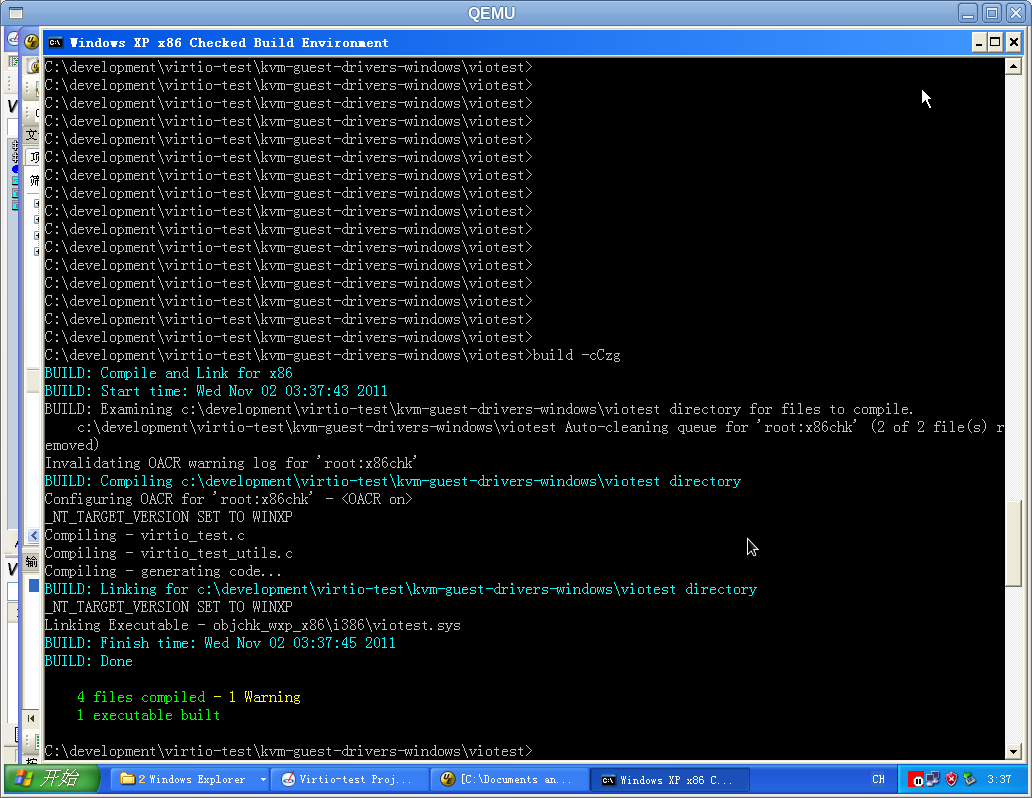
Then using WinDDK build tool to build the driver,I use the "Windows XP x86 checked build".
After build completely,the driver(viotest.sys,viotest.inf) will be exported into the ...\viotest\objchk_wxp_x86\i386\.
Load,install and debug the driver
After the process mentioned below,we copy the viotest directory to the target guest. HOST: WinDbg is now running in the host guest. We Ctrl+Break to pause the debugger,and set breakpoints:
kd> bu !viotest:DriverEntry
kd> bu !viotest:DriverUnload
You can use "bl" to watch breakpoints set.
F5,continue.
Using tool [DriverStudio] to load,start,stop the driver on target.
File->Open select the viotest.sys, and then start (Go)the driver.
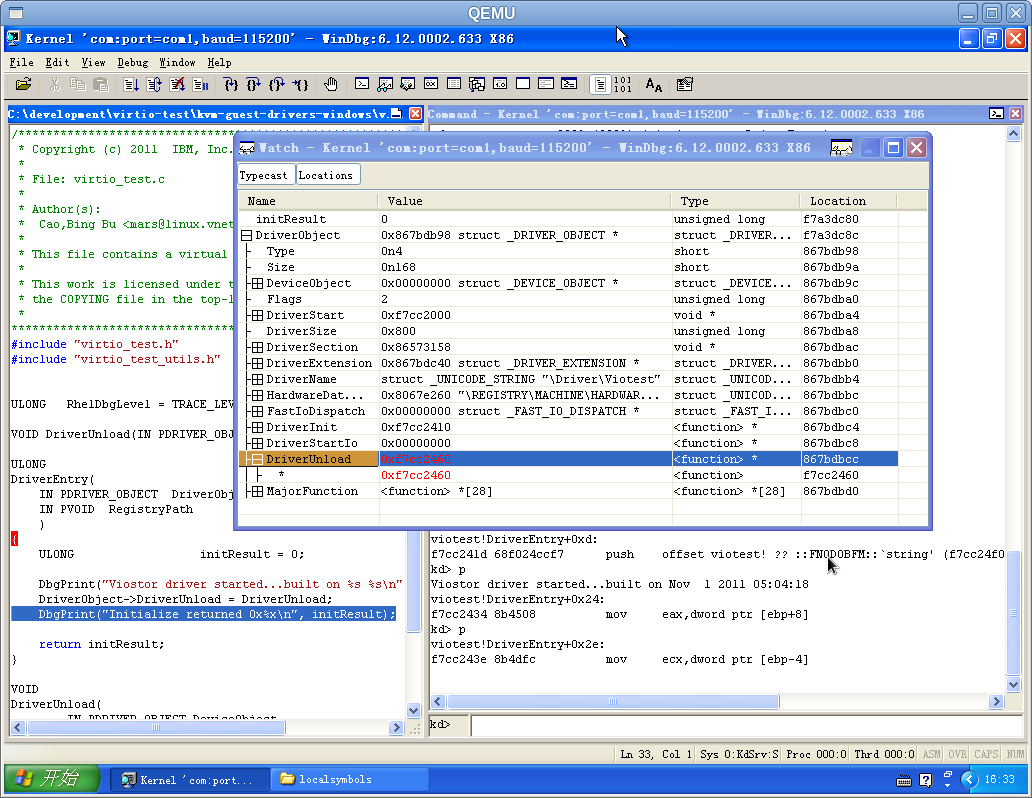
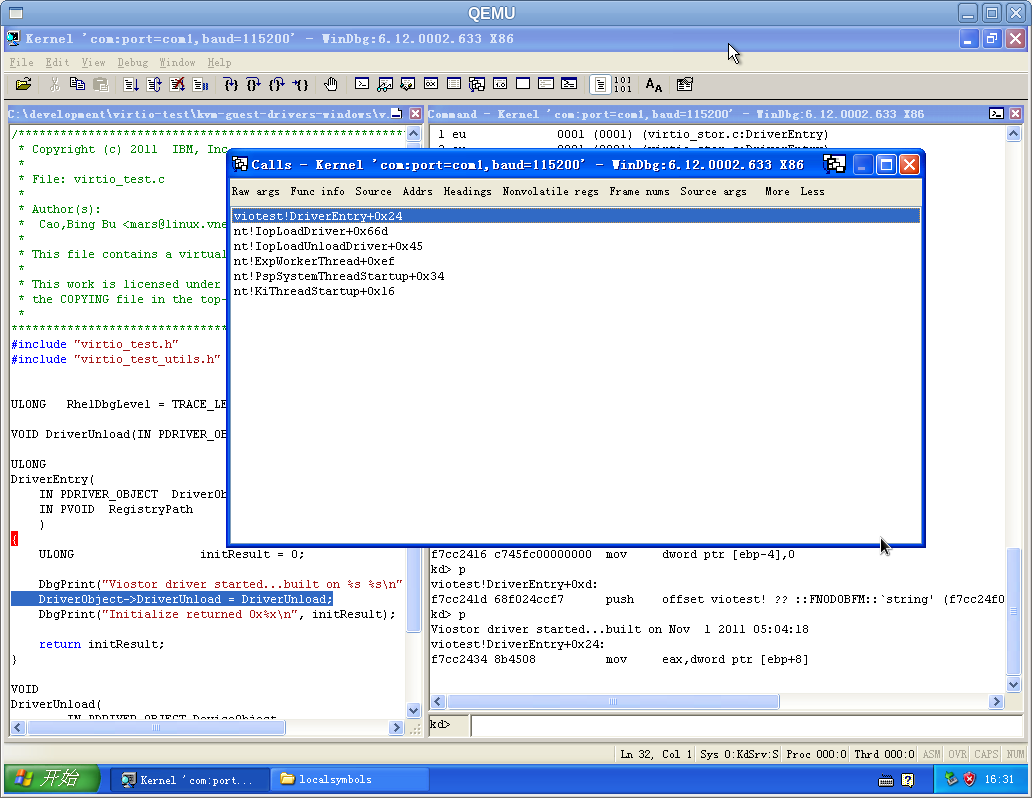
Meanwhile,the WinDbg will hit the breakpoint at viotest.c:DriverEntry().
And the related source file will be opened to view.
You can see the breakpoints position with highlight label in the source code
 also can watch the variables value,check the callstacks etc. All behaviors of WinDbg are similar to other debuggers.


The debug message will be show in the WinDbg.
"viotest driver started...build on Nov 1 2011 05:04:18"
"Initialize return 0x0"
When stop(unload) the driver,the breakpoint will also be hit at DriverUnload().
The debug message will also be show in the WinDbg
"Driver Unload sucessfully\!"
Other Debug Method
- Using Debug message(print):
- The message can be viewed by another tool DebugView,it can be used in target guest(without WinDbg) only environment to debug the driver with the DbgPrint() debug message. It is also a available method to debug the driver.
- Using crash dump (kernel memory dump)with WinDbg
- TBD.
Problems may be encountered
- WinDbg somtimes exit unexpectedly when connecting to the target
- I have not found the exact reason,but I found this problem often appears when changing the QEMU virtual hardware configuration or the target is not be shut off normally.It may be the Windows registry conflict cause this issue.
- WinDbg and virtual machine runs slowly
- It is recommended by Avi Kivity( avi@redhat.com)using QEMU-KVM which is significantly faster,especially running Windows,but the WinDbg will almost exit everytime when using qemu-kvm git.
References
- 1). Guest Debugging on this site
- 2).http://msdn.microsoft.com/library/windows/hardware/gg507680
- 3).Debugging tools for Windows HELP
- 4).Developing_drivers_with_the_Microsoft_Windows_Driver_Foundation by Penny Orwich and Guy Smith,Microsoft Press 2007
(author: Cao,Bing Bu )
