Virtio/Block/Latency
This page describes how virtio-blk latency can be measured. The aim is to build a picture of the latency at different layers of the virtualization stack for virtio-blk.
Benchmarks
Single-threaded read or write benchmarks are suitable for measuring virtio-blk latency. The guest should have 1 vcpu only, which simplifies the setup and analysis.
The benchmark I use is a simple C program that performs sequential 4k reads on an O_DIRECT file descriptor, bypassing the page cache. The aim is to observe the raw per-request latency when accessing the disk.
Tools
Linux kernel tracing (ftrace and trace events) can instrument host and guest kernels. This includes finding system call and device driver latencies.
Trace events in QEMU can instrument components inside QEMU. This includes virtio hardware emulation and AIO. Trace events are not upstream as of writing but can be built from git branches:
http://repo.or.cz/w/qemu-kvm/stefanha.git/shortlog/refs/heads/tracing-dev-0.12.4
This particular commit message explains how to use the simple trace backend for latency tracing.
Instrumenting the stack
Guest
The single-threaded read/write benchmark prints the mean time per operation at the end. This number is the total latency including guest, host, and QEMU. All latency numbers from layers further down the stack should be smaller than the guest number.
Guest virtio-pci
The virtio-pci latency is the time from the virtqueue notify pio write until the vring interrupt. The guest performs the notify pio write in virtio-pci code. The vring interrupt comes from the PCI device in the form of a legacy interrupt or a message-signaled interrupt.
Ftrace can instrument virtio-pci inside the guest:
cd /sys/kernel/debug/tracing
echo 'vp_notify vring_interrupt' >set_ftrace_filter
echo function >current_tracer
cat trace_pipe >/path/to/tmpfs/trace
Note that putting the trace file in a tmpfs filesystem avoids causing disk I/O in order to store the trace.
Host kvm
The kvm latency is the time from the virtqueue notify pio exit until the interrupt is set inside the guest. This number does not include vmexit/entry time.
Events tracing can instrument kvm latency on the host:
cd /sys/kernel/debug/tracing
echo 'port == 0xc090' >events/kvm/kvm_pio/filter
echo 'gsi == 26' >events/kvm/kvm_set_irq/filter
echo 1 >events/kvm/kvm_pio/enable
echo 1 >events/kvm/kvm_set_irq/enable
cat trace_pipe >/tmp/trace
Note how kvm_pio and kvm_set_irq can be filtered to only trace events for the relevant virtio-blk device. Use lspci -vv -nn and cat /proc/interrupts inside the guest to find the pio address and interrupt.
QEMU virtio
The virtio latency inside QEMU is the time from virtqueue notify until the interrupt is raised. This accounts for time spent in QEMU servicing I/O.
- Run with 'simple' trace backend, enable virtio_queue_notify() and virtio_notify() trace events.
- Use ./simpletrace.py trace-events /path/to/trace to pretty-print the binary trace.
- Find vdev pointer for correct virtio-blk device in trace (should be easy because most requests will go to it).
- Use qemu_virtio.awk only on trace entries for the correct vdev.
QEMU paio
The paio latency is the time spent performing pread()/pwrite() syscalls. This should be similar to latency seen when running the benchmark on the host.
- Run with 'simple' trace backend, enable the posix_aio_process_queue() trace event.
- Use ./simpletrace.py trace-events /path/to/trace to pretty-print the binary trace.
- Only keep reads (type=0x1 requests) and remove vm boot/shutdown from the trace file by looking at timestamps.
- Use qemu_paio.py to calculate the latency statistics.
Results
Host
The host is 2x4-cores, 8 GB RAM, with 12 LVM striped FC LUNs. Read and write caches are enabled on the disks.
The host kernel is kvm.git 37dec075a7854f0f550540bf3b9bbeef37c11e2a from Sat May 22 16:13:55 2010 +0300.
The qemu-kvm is 0.12.4 with patches as necessary for instrumentation.
Guest
The guest is a 1 vcpu, x2apic, 4 GB RAM virtual machine running a 2.6.32-based distro kernel. The root disk image is raw and the benchmark storage is an LVM volume passed through as a virtio disk with cache=none.
Performance data
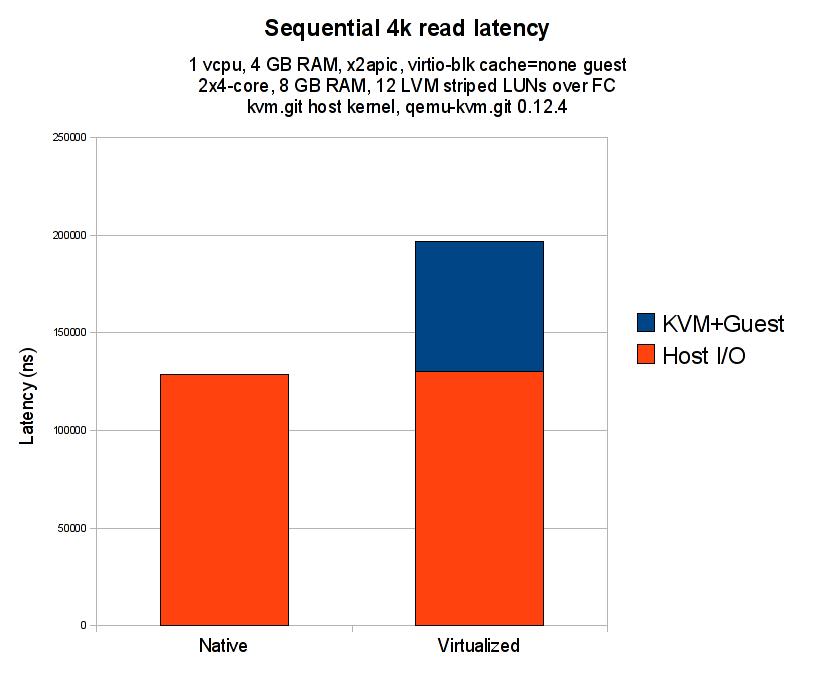
The following diagram compares the benchmark when run on the host against run inside the guest:
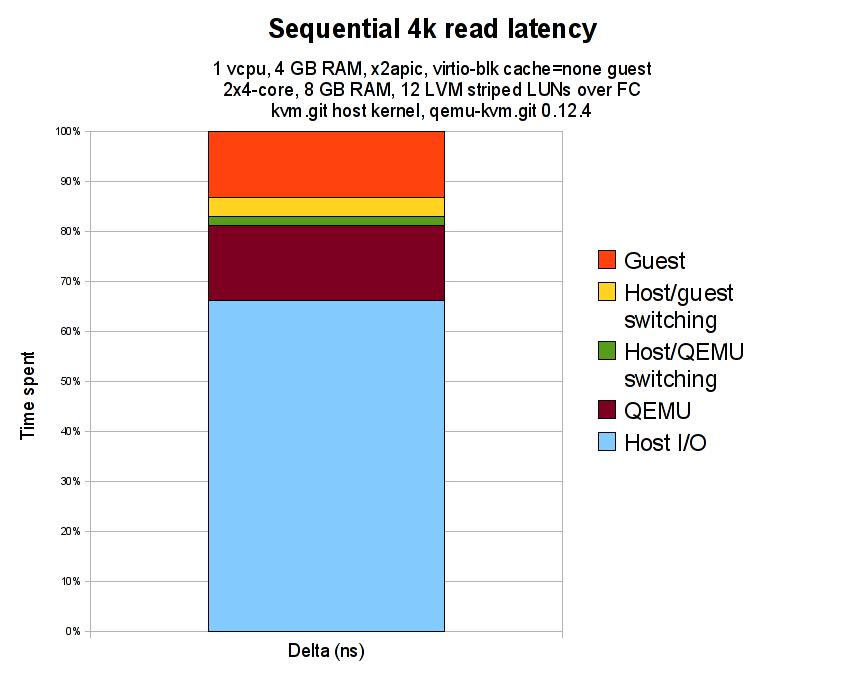
The following diagram shows the time spent in the different layers of the virtualization stack:
Here is the raw data used to plot the diagram:
| Layer | Cumulative latency (ns) | Guest benchmark control (ns) |
|---|---|---|
| Guest benchmark | 196528 | |
| Guest virtio-pci | 170829 | 202095 |
| Host kvm.ko | 163268 | |
| QEMU virtio | 159628 | 205165 |
| QEMU paio | 130235 | 202777 |
| Host benchmark | 128862 |
The Guest benchmark control (ns) column is the latency reported by the guest benchmark for that run. It is useful for checking that overall latency has remained relatively similar across benchmarking runs.
The following numbers for the layers of the stack are derived from the previous numbers by subtracting successive latency readings:
| Layer | Delta (ns) | Delta (%) |
|---|---|---|
| Guest | 25699 | 13.08% |
| Host/guest switching | 7561 | 3.85% |
| Host/QEMU switching | 3640 | 1.85% |
| QEMU | 29393 | 14.96% |
| Host I/O | 130235 | 66.27% |
The Delta (ns) column is the time between two layers, e.g. Guest benchmark and Guest virtio-pci. The delta time tells us how long is being spent in a layer of the virtualization stack.
Analysis
The sequential read case is optimized by the presence of a disk read cache. I think this is why the latency numbers are in the microsecond range, not the usual millisecond seek time expected from disks. However, read caching is not an issue for measuring the latency overhead imposed by virtualization since the cache is active for both host and guest measurements.
The results give a 33% virtualization overhead. I expected the overhead to be higher, around 50%, which is what single-process dd bs=8k iflag=direct benchmarks show for sequential read throughput. The results I collected only measure 4k sequential reads, perhaps the picture may vary with writes or different block sizes.
Guest
The Guest 202095 ns latency (13% of total) is high. The guest should be filling in virtio-blk read commands and talking to the virtio-blk PCI device, there isn't much interesting work going on inside the guest.
The seqread benchmark inside the guest is doing sequential read() syscalls in a loop. A timestamp is taken before the loop and after all requests have finished; the mean latency is calculated by dividing this total time by the number of read() calls.
The Guest virtio-pci tracepoints provide timestamps when the guest performs the virtqueue notify via a pio write and when the interrupt handler is executed to service the response from the host.
Between the seqread userspace program and virtio-pci are several kernel layers, including the vfs, block, and io scheduler. Previous guest oprofile data from Khoa Huynh showed __make_request and get_request taking significant amounts of CPU time.
Possible explanations:
- Inefficiency in the guest kernel I/O path as suggested by past oprofile data.
- Expensive operations performed by the guest, besides the pio write vmexit and interrupt injection which are accounted for by Host/guest switching and not included in this figure.
- Timing inside the guest can be inaccurate due to the virtualization architecture. I believe this issue is not too severe on the kernels and qemu binaries used because the guest latency stacks up with host latency. Ideally, guest tracing could be performed using host timestamps so guest and host timestamps can be compared accurately.
QEMU
The QEMU 29393 ns latency (~15% of total) is high. The QEMU layer accounts for the time between virtqueue notify until issuing the pread64() syscall and return of the syscall until raising an interrupt to notify the guest. QEMU is building AIO requests for each virtio-blk read command and transforming the results back again before raising an interrupt.
Possible explanations:
- QEMU iothread mutex contention due to the architecture of qemu-kvm. In preliminary futex wait profiling on my laptop, I have seen threads blocking on average 20 us when the iothread mutex is contended. Further work could investigate whether this is the case here and then how to structure QEMU in a way that solves the lock contention. See futex.gdb and futex.py for futex profiling using ftrace in my tracing branch:
$ gdb -batch -x futex.gdb -p $(pgrep qemu) # to find futex addresses
# echo 'uaddr == 0x89b800 || uaddr == 0x89b9e0' >events/syscalls/sys_enter_futex/filter # to trace only those futexes
# echo 1 >events/syscalls/sys_enter_futex/enable
# echo 1 >events/syscalls/sys_exit_futex/enable
[...run benchmark...]
# ./futex.py </tmp/trace
Known issues
- Mean average latencies don't show the full picture of the system. I have copies of the raw trace data which can be used to look at the latency distribution.
- Choice of I/O syscalls may result in different performance. The seqread benchmark uses 4k read() syscalls while the qemu binary services these I/O requests using pread64() syscalls. Comparison between the host benchmark and QEMU paio would be more correct when using pread64() in the benchmark itself.
Zooming in on QEMU userspace virtio-blk latency
The time spent in QEMU servicing a read request made up 29 us or a 23% overhead compared to a host read request. This deserves closer study so that the overhead can be reduced.
The benchmark QEMU binary was updated to qemu-kvm.git upstream [Tue Jun 29 13:59:10 2010 +0100] in order to take advantage of the latest optimizations that have gone into qemu-kvm.git, including the virtio-blk memset elimination patch.
Trace events
Latency numbers can be calculated by recording timestamps along the I/O code path. The trace events work, which adds static trace points to QEMU, is a good mechanism for this sort of instrumentation.
The following trace events were added to QEMU:
| Trace event | Description |
|---|---|
| virtio_add_queue | Device has registered a new virtqueue |
| virtio_queue_notify | Guest -> host virtqueue notify |
| virtqueue_pop | A buffer has been removed from the virtqueue |
| virtio_notify | Host -> guest virtqueue notify |
| virtio_blk_rw_complete | Read/write request completion |
| paio_submit | Asynchronous I/O request submission to worker threads |
| posix_aio_process_queue | Asynchronous I/O request completion |
| posix_aio_read | Asynchronous I/O completion events pending |
| qemu_laio_enqueue_completed | Linux AIO completion events are about to be processed |
| qemu_laio_completion_cb | Linux AIO request completion |
| laio_submit | Linux AIO request is being issued to the kernel |
| laio_submit_done | Linux AIO request has been issued to the kernel |
| main_loop_wait_entry | Iothread main loop iteration start |
| main_loop_wait_exit | Iothread main loop iteration finish |
| main_loop_wait_pre_select | Iothread about to block in the select(2) system call |
| main_loop_wait_post_select | Iothread resumed after select(2) system call |
| main_loop_wait_iohandlers_done | Iothread callbacks for select(2) file descriptors finished |
| main_loop_wait_timers_done | Iothread timer processing done |
| kvm_set_irq_level | About to raise interrupt in guest |
| kvm_set_irq_level_done | Finished raising interrupt in guest |
| pre_kvm_run | Vcpu about to enter guest |
| post_kvm_run | Vcpu has exited the guest |
| kvm_run_exit_io_done | Vcpu io exit handler finished |
Results
All time measurements in microseconds.

* QEMU userspace latency:
 * paio_submit/laio_submit 8 us latency:
   * backport memset patch
   * stash last unused virtio block request instead of alloc and free
   * avoid vring access overhead with RAM API
   * virtqueue_pop trace event helps split up this latency
 * aio=threads
   * seqread 200.309 us
   * virtio_queue_notify 45.292
   * paio_submit 8.023
   * posix_aio_read 143.724
   * posix_aio_process_queue 1.965
   * virtio_blk_rw_complete 0.260
   * virtio_notify 1.034
   * total 155.006
 * aio=native
   * seqread 193.374 us
   * virtio_queue_notify 44.464
   * laio_submit 8.377
   * qemu_laio_completion_cb 136.241
   * qemu_laio_enqueue_completed 1.754
   * virtio_blk_rw_complete 0.294
   * virtio_notify 1.342
   * total 148.008
 * aio=native + memset
   * seqread 186.468 us
   * virtio_queue_notify 44.696
   * virtqueue_pop 2.446
   * laio_submit 1.711
   * qemu_laio_completion_cb 134.478
   * qemu_laio_enqueue_completed 1.737
   * virtio_blk_rw_complete 0.296
   * virtio_notify 1.087
   * total 141.755

